The multiple genome alignment table was constructed containing the intragenomic and intergenomic comparisons among representative basal and core eudicot genomes (C. chinensis, A. coerulea, P. somniferum, T. sinense and V. vinifera). The multiple genome alignment tables include the orthologs produced by divergence between genomes and the paralogs produced by WGD events. We can search the genes, gene families, regulatory pathways and economically and agriculturally important genes using multiple genome alignment tables, which is critical for inferring the evolutionary history of basal and core eudicots.
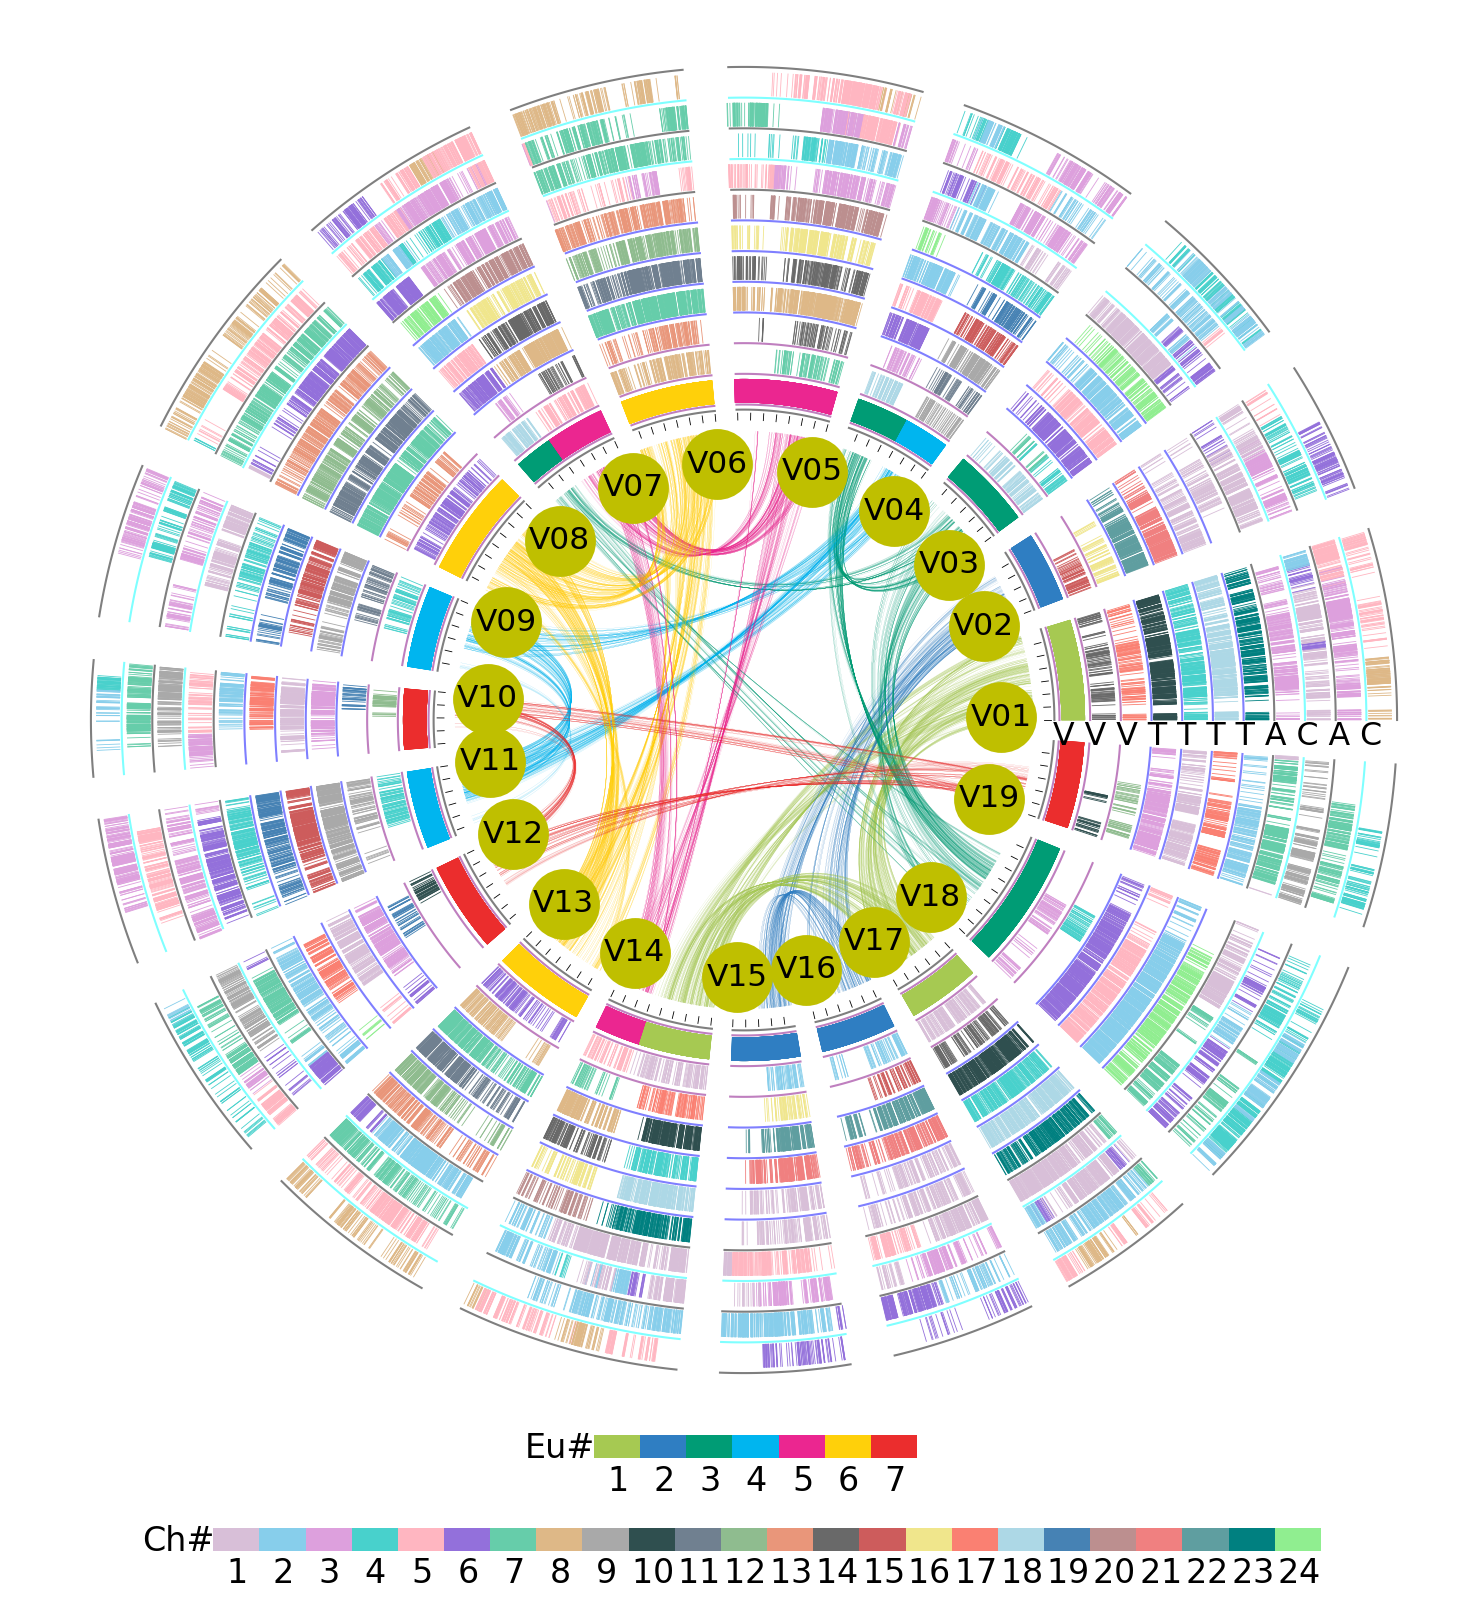
Homologous alignments of selected genomes with V. vinifera as reference. Homologous alignment of C. chinensis, A. coerulea, P. somniferum and T. sinense genomes with V. vinifera as a reference: A. coerulea (A), C. chinensis (C), P. somniferum (P), T. sinense (T) and V. vinifera (V). The curves in the inner circle are made up of 19 chromosomes of V. vinifera, chromosome blocks are represented by short lines and correspond to the color of the seven ancestral chromosomes, each short line representing one gene.
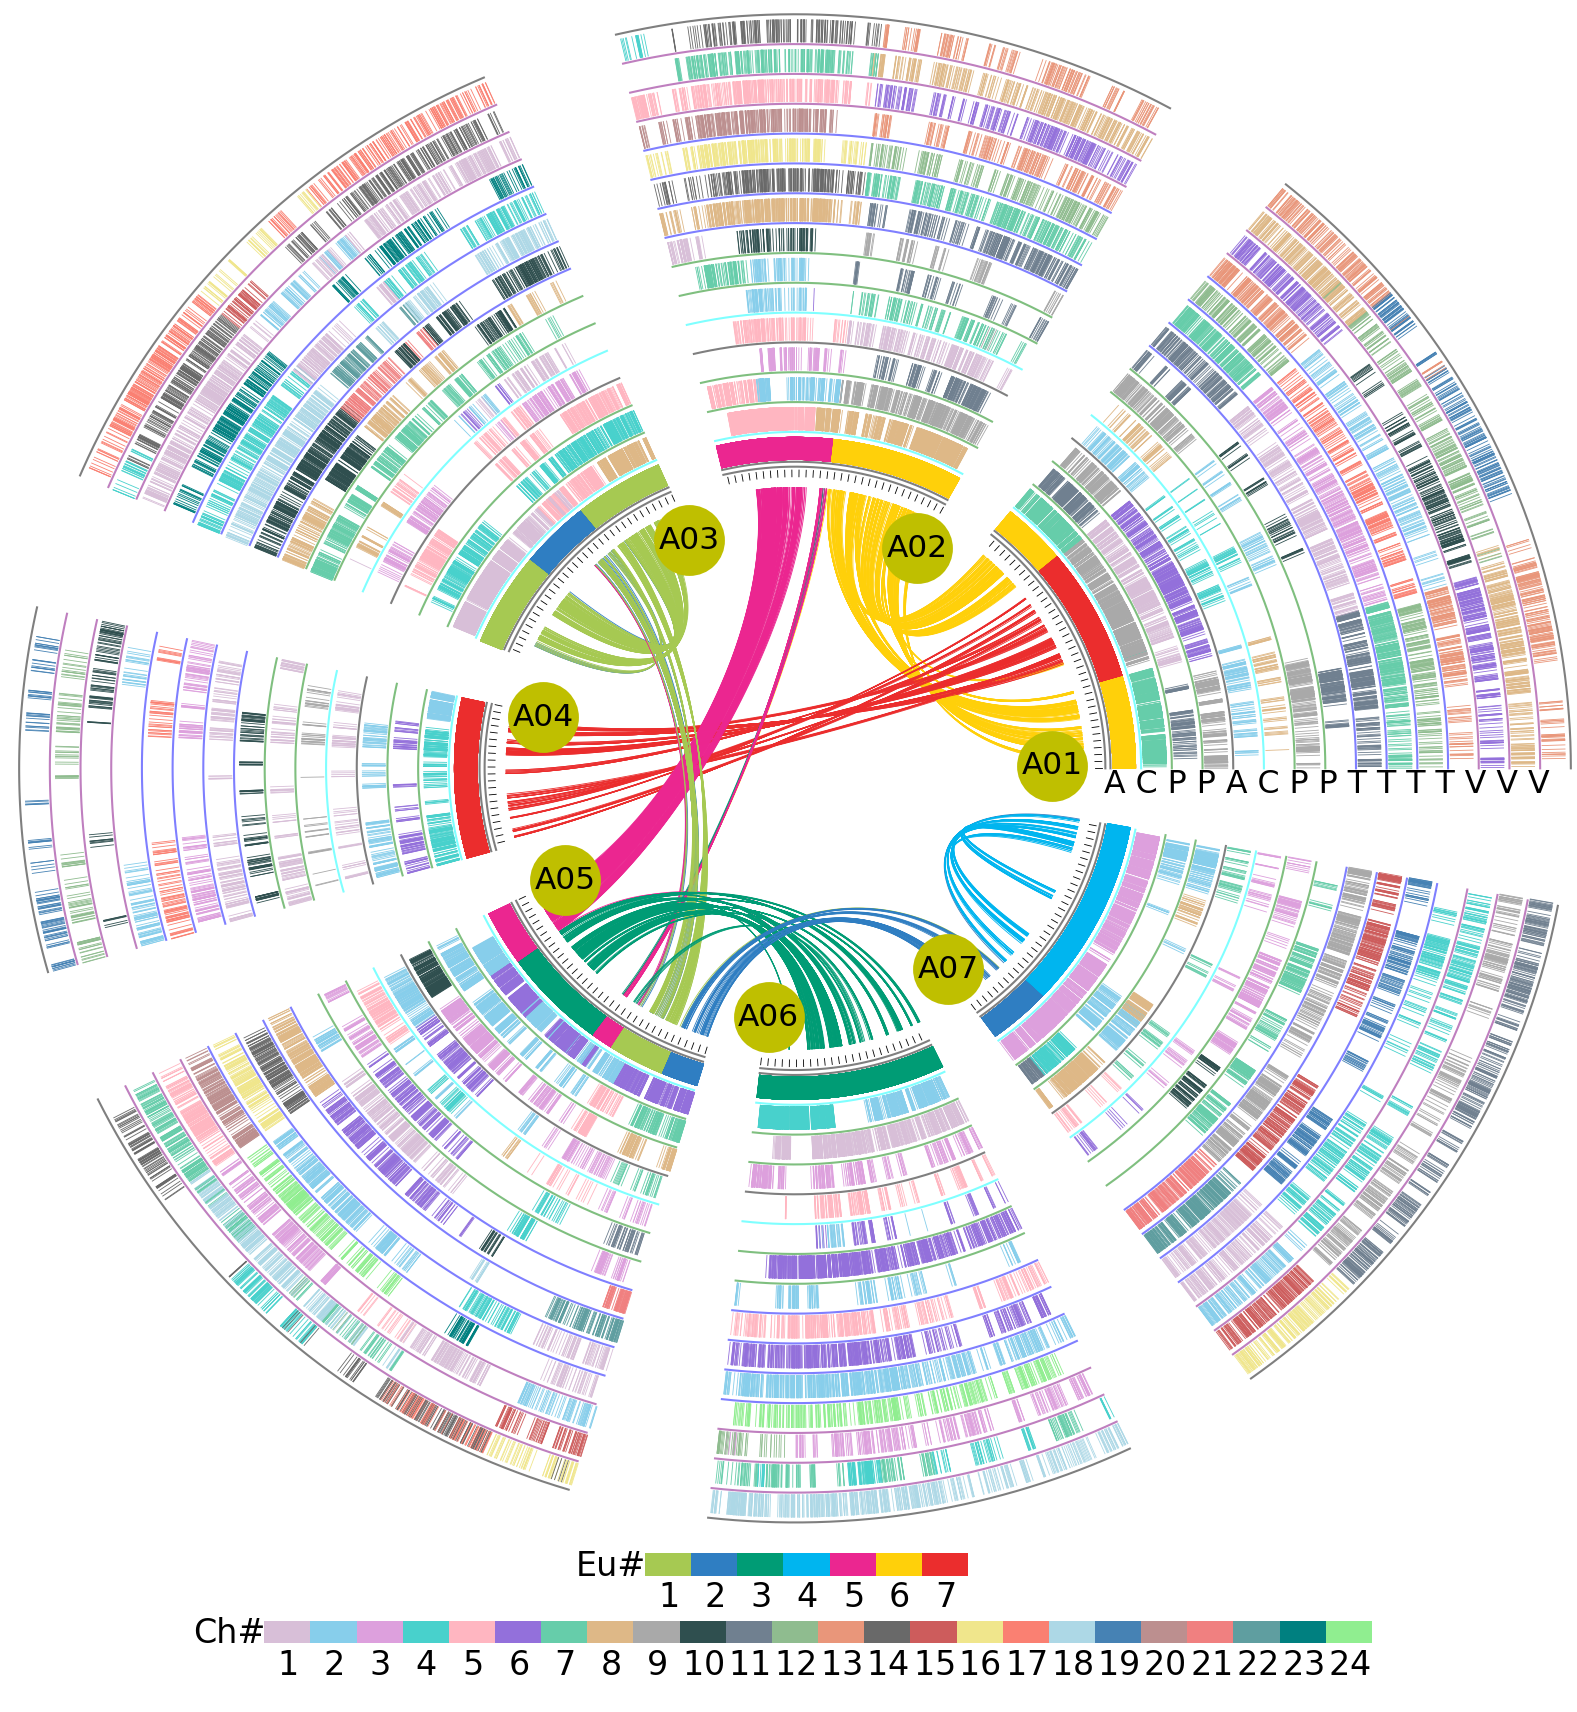
Homologous alignments with A. coerulea (A) as a reference. Genomic paralogy, orthology, and outparalogy information within and among C. chinensis (C), P
somniferum(P), T. sinense (T) and V. vinifera (V) genomes are displayed in 11 circles, each corresponding to an extant gene in Figure 1, d. The curved lines within the inner circle are formed by 7 A. coerulea chromosomes color coded to correspond to the seven ancestral chromosomes before the Gamma event (Jaillon et al. 2007). The short lines forming the innermost A. coerulea chromosome circles represent predicted genes, which have one set of paralogous regions, thus forming another circle. Each of the two paralogous regions of A. coerulea has two, four and three orthologs in the C. chinensis, T. sinense and V. vinifera genomes. Each circle has an underline color to indicate its source plant, and each circle is formed by short vertical lines that denote homologous genes. The color scheme is shown at the bottom.