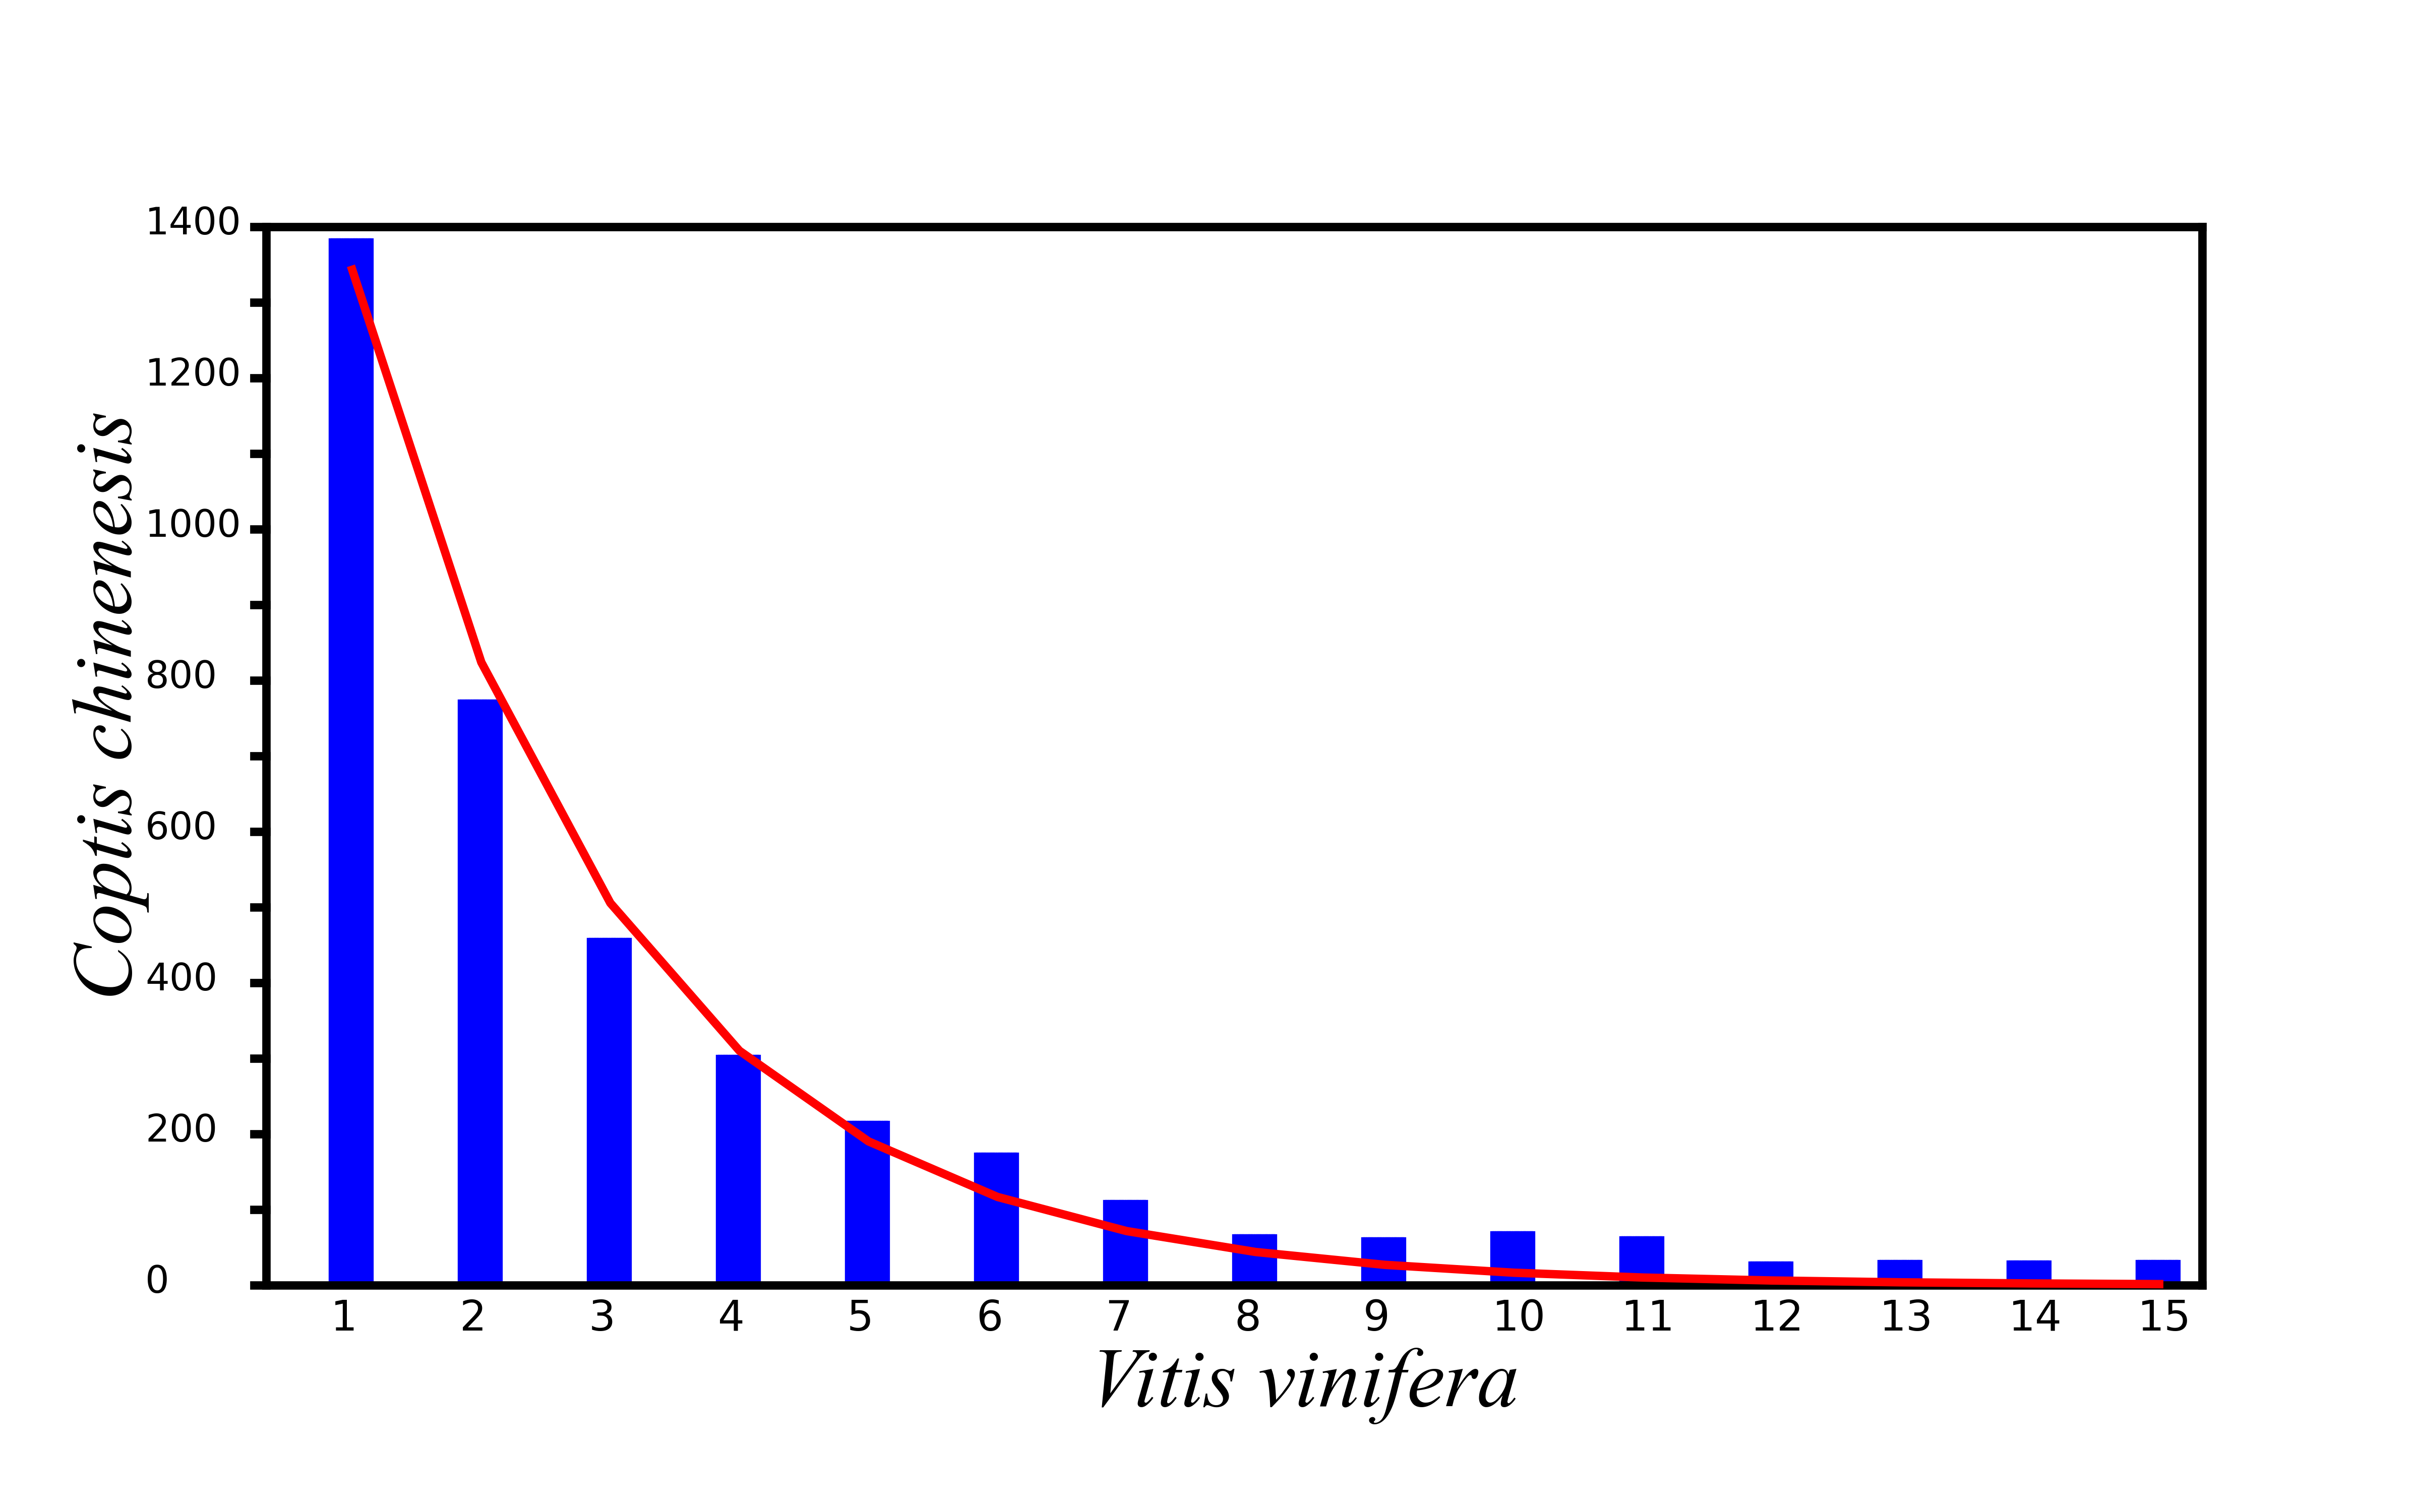
The gene loss rates of C. chinensis with the V. vinifera genome as a reference. The x-axis represents the number of continuously missing genes in the syntenic region of genes, and the y-axis represents the length of missing gene fragments. The red curve is fitted according to the loss of genes.

Aquilegia coerulea gene retention along corresponding orthologous to V. vinifera chromosomes. Rates of retained genes in sliding windows of A. coerulea homologous region group 1 (red line) and homologous region group 2 (black line), using grapes as the reference, in A; Rates of retained genes (blue line) between sliding windows of A. coerulea homologous region group 1 and 2 (blue line), in B. Genomic paralogous and orthologous information within and among genomes was displayed in three circles. Each circle was formed by short vertical lines that denoted homologous genes, which were colored to indicate chromosome number in their respective source plant as shown in the color scheme at the bottom.
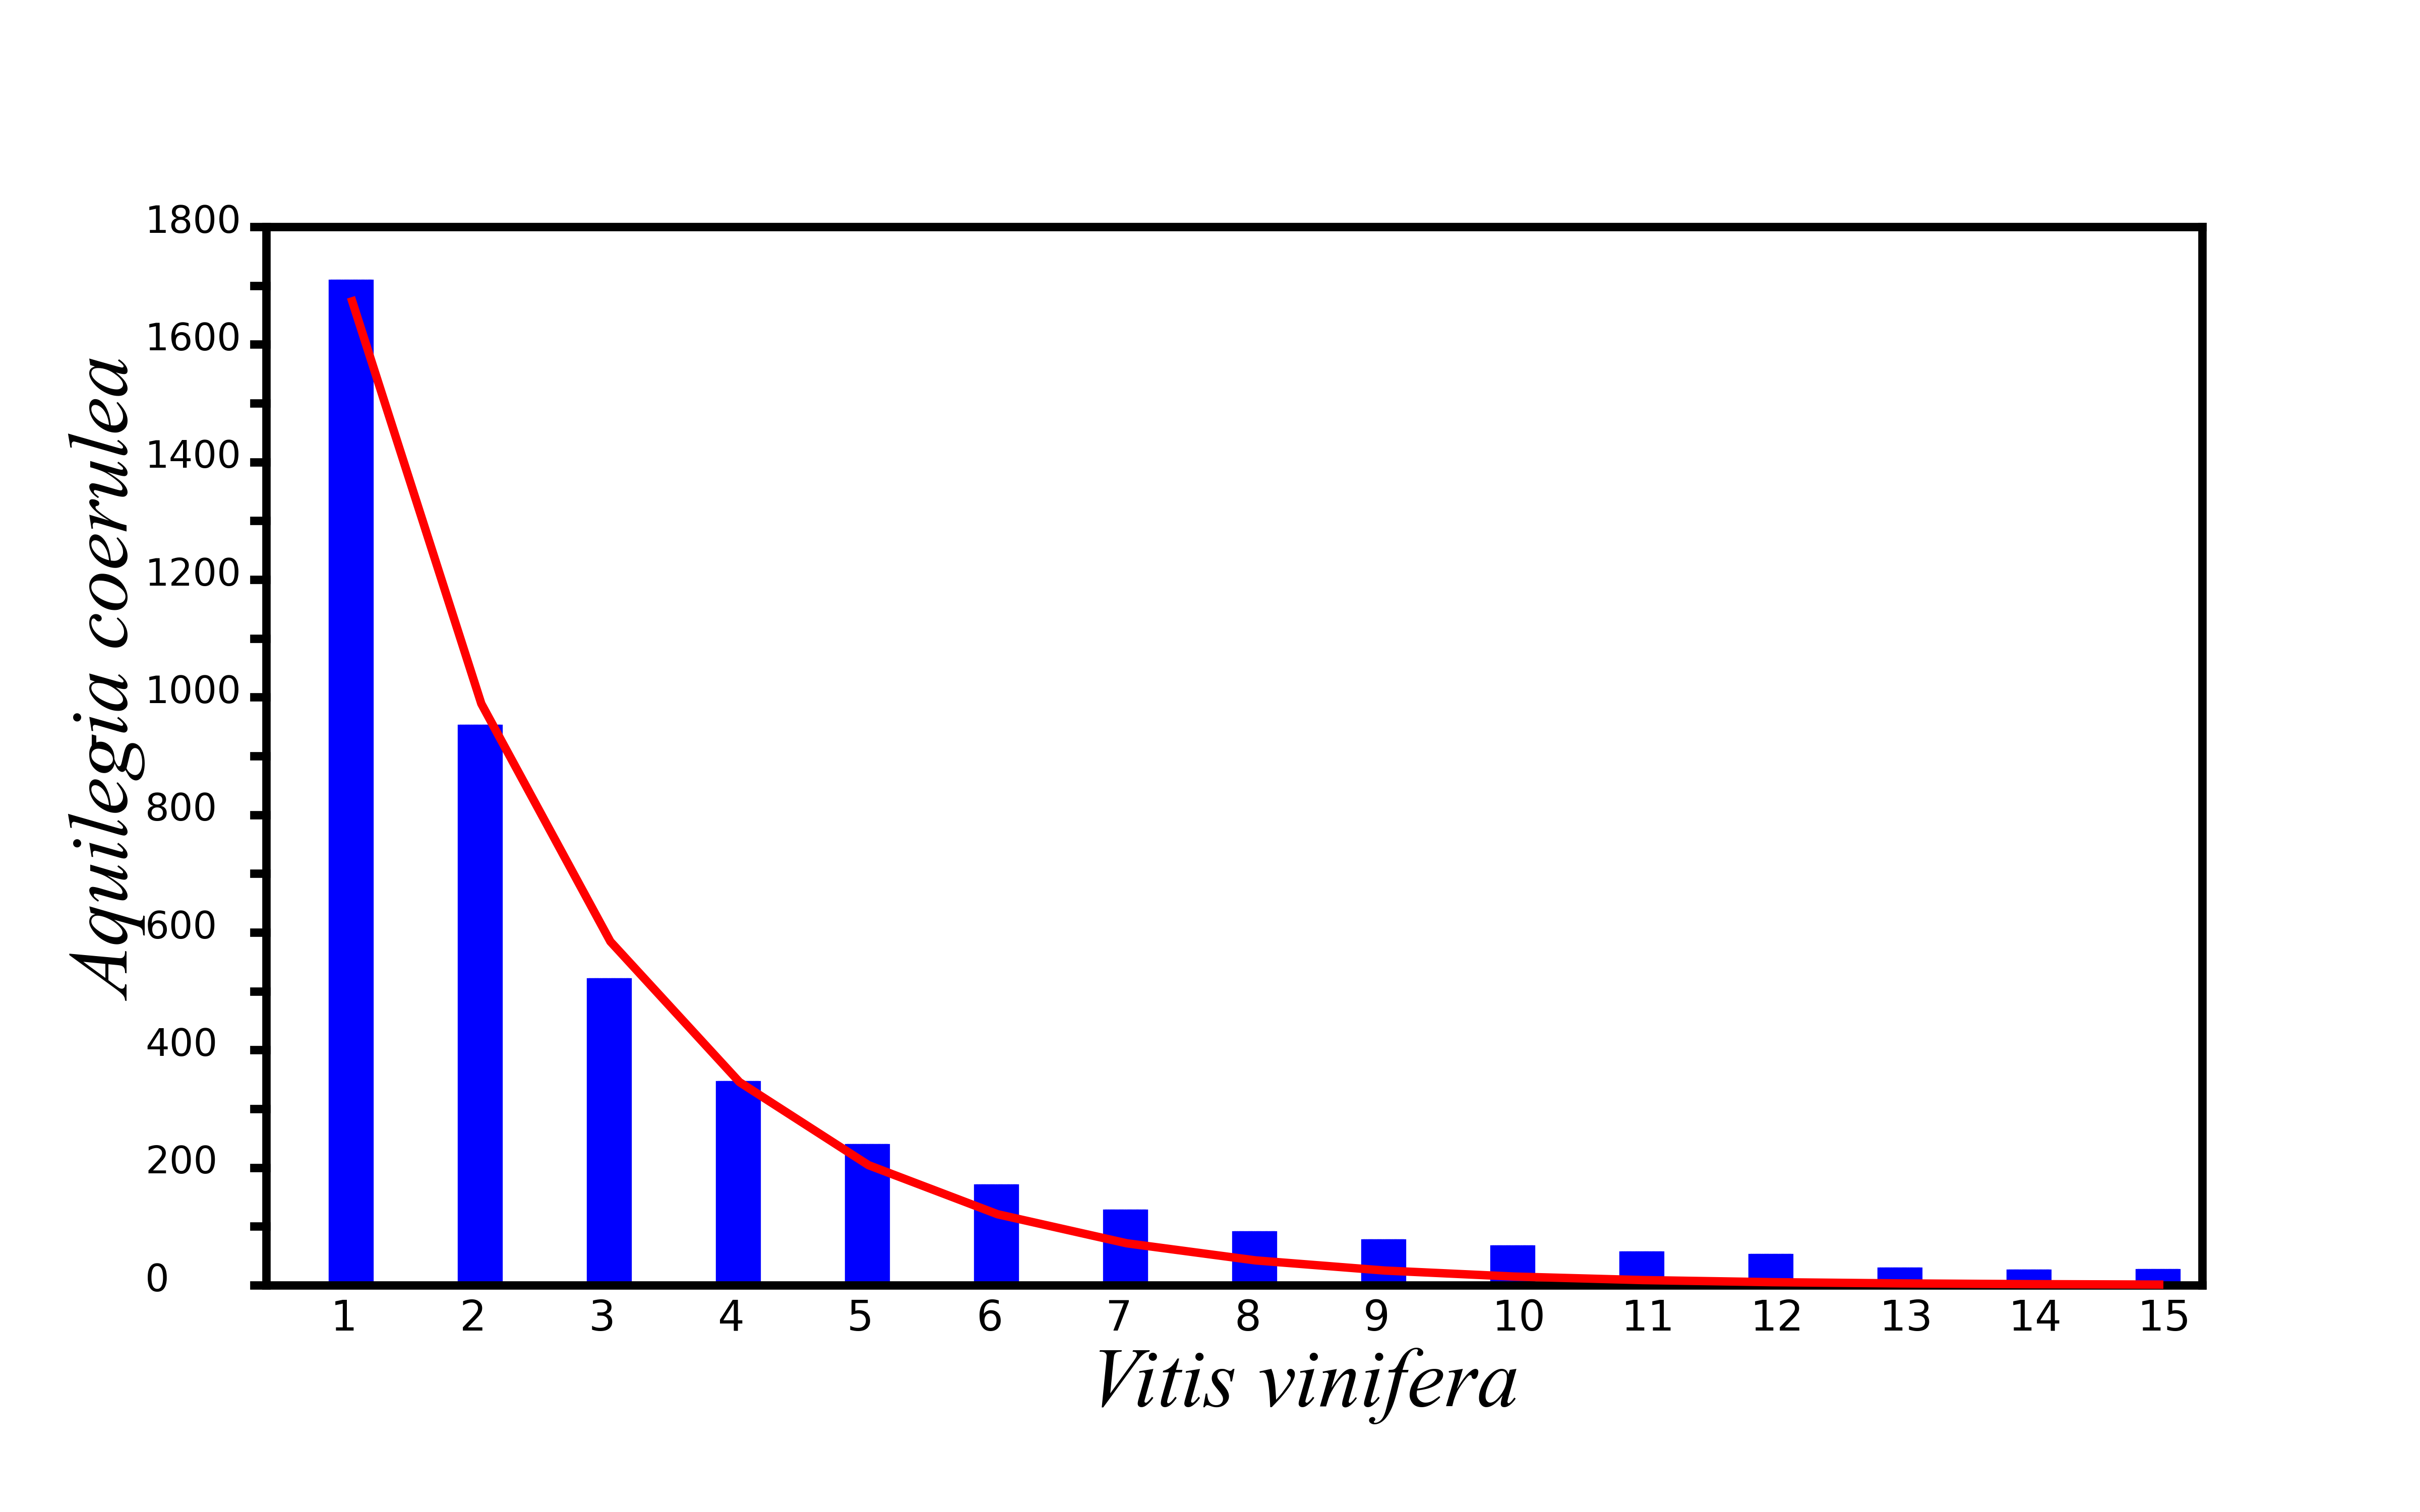
The gene loss rates of A. coerulea with the V. vinifera genomes as a reference.

C. chinensis gene retention along corresponding orthologous regions of V. vinifera chromosomes. A, Retention rates of genes in sliding windows of C. chinensis homologous region group 1 (red line) and homologous region group 2 (black line), using grape as the reference; B, retention rates of genes between sliding windows of C. chinensis homologous region groups 1 and 2 (blue line). Genomic information on paralogous and orthologous regions within and among genomes is displayed in the three circles. Each circle is formed by short vertical lines that denoted homologous genes, which were colored to indicate the chromosome number in their respective source plant, as shown in the color scheme at the bottom.