Help documentation
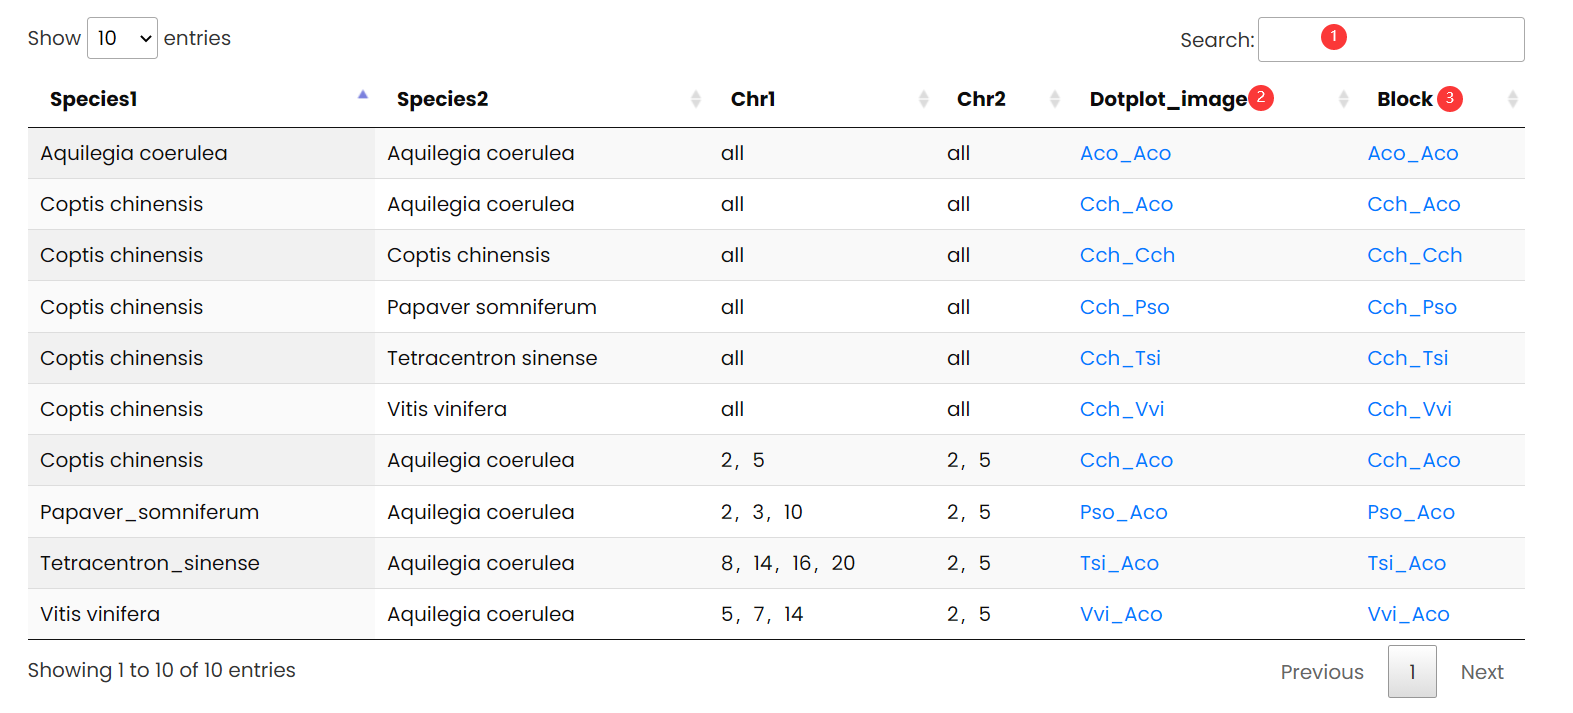
1. Enter the name of the species to search for the row in which the species resides.
2. The best, secondary, and other matched homologous gene pairs output by Diamond are plotted in red, gray, and gray respectively.
3. Colinear pairs of genes between two species.
2. The best, secondary, and other matched homologous gene pairs output by Diamond are plotted in red, gray, and gray respectively.
3. Colinear pairs of genes between two species.
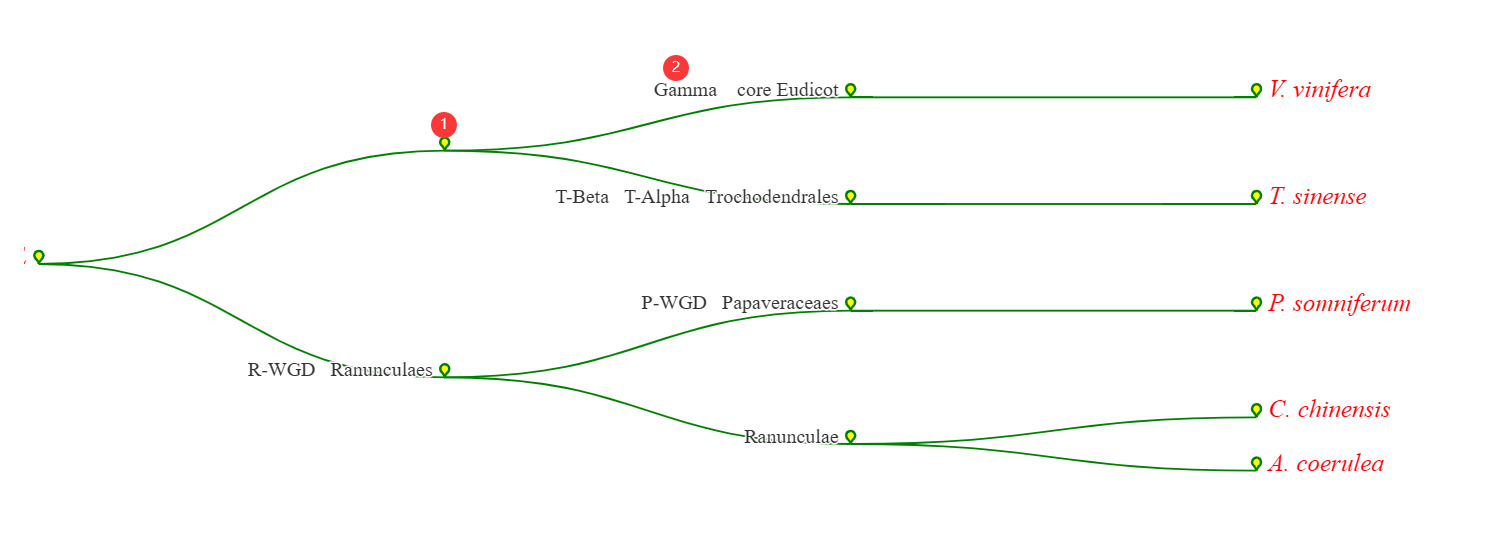
1. Each branchlet folds.
2. Here's some doubled information.
2. Here's some doubled information.
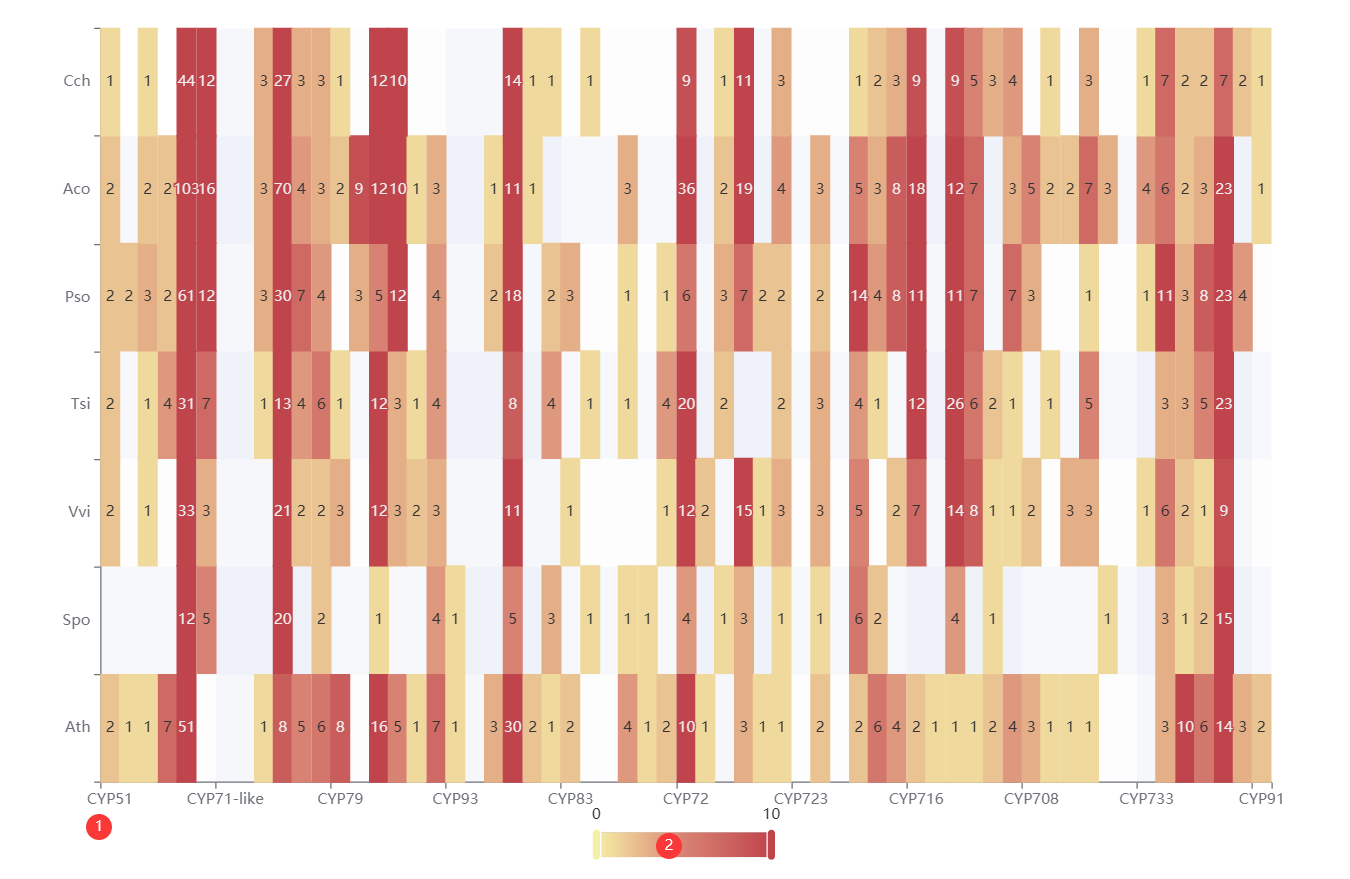
1. The rows represent each gene family and the columns represent species. And each column can be clicked to view the gene family phylogenetic tree.
2. The number represents the number of genes in the modified gene family.
2. The number represents the number of genes in the modified gene family.
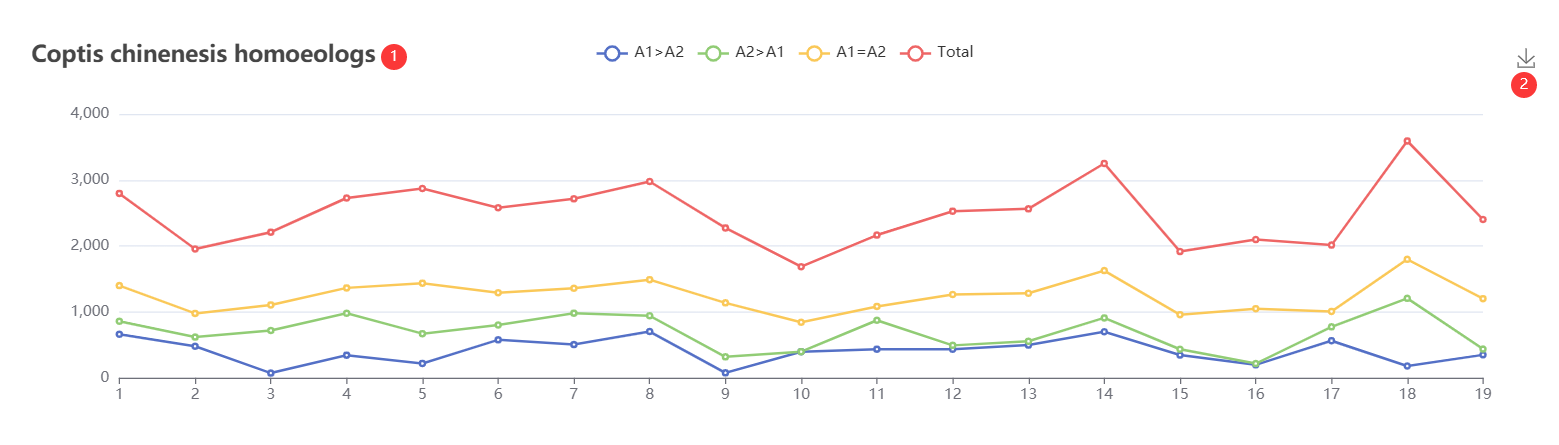
1. Visualization of p-index of plant subgenomic retention in plant genomes results.
2. You can download and save this picture.
2. You can download and save this picture.
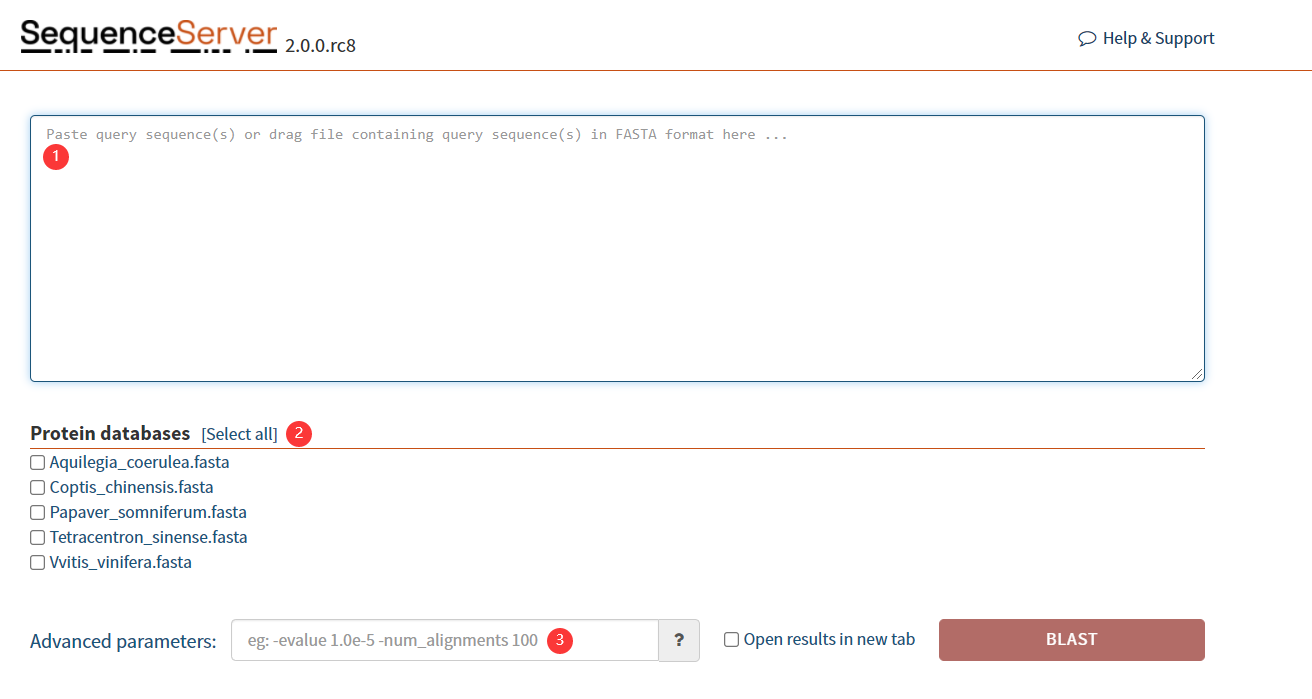
1. Input protein sequence.
2. Selective protein database.
3. Setting Related Parameters
2. Selective protein database.
3. Setting Related Parameters